Demo
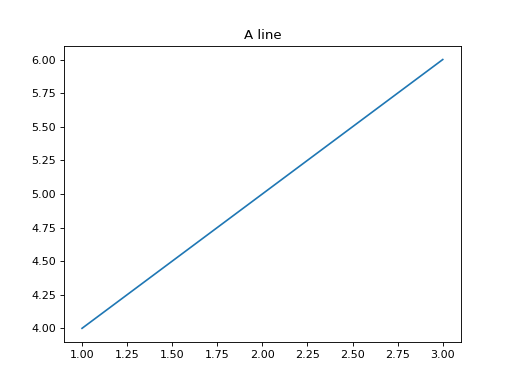
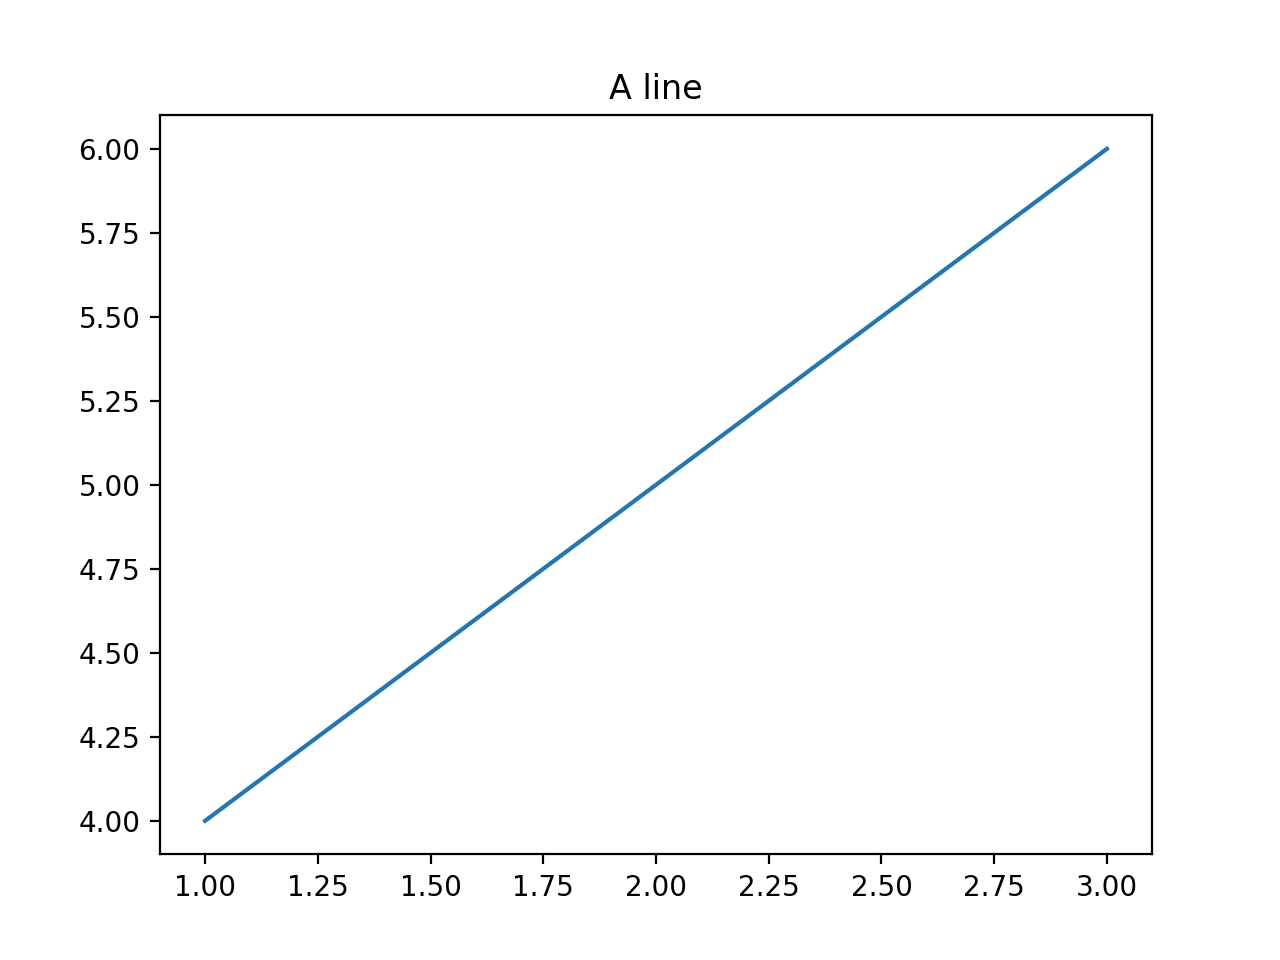
import matplotlib.pyplot as plt

plt.plot([1,2,3], [4,5,6])
plt.title('A line')
(Source code, png, hires.png, pdf)

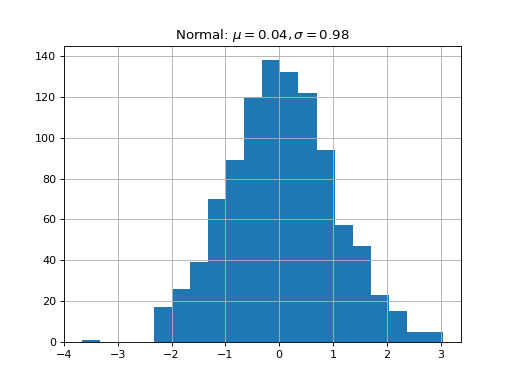
import matplotlib.pyplot as plt
import numpy as np

x = np.random.randn(1000)
plt.hist(x, 20)
plt.grid()
plt.title(r'Normal: $\mu=%.2f, \sigma=%.2f$'%(x.mean(), x.std()))
plt.show()
(Source code, png, hires.png, pdf)